Notre dernière recherche sur l’allocation globale entre les fonds Actifs & Passifs
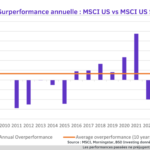
Fonds actifs vs ETF en 2022: Qui est le gagnant ?
Sur l'ensemble de l'année 2022, 36% des gérants actifs ont surperformé la gestion passive. Ce chiffre masque une situation contrastée tout au long de l'année. Au premier semestre, dans un contexte de crise géopolitique et un environnement économique incertain, peu de gérants actifs sont parvenus à surperformer la gestion passive, en moyenne de 36% sur les deux premiers trimestres. Au second semestre, dans le sillage du changement de politique de la Fed et du rebond du marché, on constate une amélioration significative de la performance de la gestion active comme le montre le graphique ci-dessous avec une moyenne de 51% des gérants actifs surperformant gestion passive sur les deux trimestres.
Lire plusPour découvrir toute la recherche, il faut être abonné :
Vous avez déjà un compte? Veuillez vous connectez
Cliquez ici pour découvrir le rapport en entier.
262 résultats
| Type | Univers de fonds actifs & passifs | Région | Stratégie | Période | Téléchargement | ||
|---|---|---|---|---|---|---|---|
| Flows & AuM | All worldwide funds | Global | 2021-12-31 | ||||
|
Êtes-vous intéressé par toutes les informations pour avoir une vision juste des encurs et flux des fonds actifs / passifs domiciliés en Europe (year to date analysis as of 31st December, 2021) ? Vue d’ensemble des flux et encours des fonds actifs et passifs domiciliés dans le monde entier (year to date analysis as of 31st December, 2021)
Pour découvrir le rapport complet,
|
|||||||
| Flows & AuM | All worldwide funds | Global | 2022-12-31 | ||||
|
Êtes-vous intéressé par toutes les informations pour avoir une vision juste des encurs et flux des fonds actifs / passifs domiciliés en Europe (year to date analysis as of 31st December, 2022) ? Vue d’ensemble des flux et encours des fonds actifs et passifs domiciliés dans le monde entier (year to date analysis as of 31st December, 2022)
Pour découvrir le rapport complet,
|
|||||||
| Flows & AuM | All worldwide funds | Global | 2022-06-30 | ||||
|
Êtes-vous intéressé par toutes les informations pour avoir une vision juste des encurs et flux des fonds actifs / passifs domiciliés en Europe (year to date analysis as of 30th June, 2022) ? Vue d’ensemble des flux et encours des fonds actifs et passifs domiciliés dans le monde entier (year to date analysis as of 30th June, 2022)
Pour découvrir le rapport complet,
|
|||||||
| Flows & AuM | All worldwide funds | Global | 2022-03-31 | ||||
|
Êtes-vous intéressé par toutes les informations pour avoir une vision juste des encurs et flux des fonds actifs / passifs domiciliés en Europe (year to date analysis as of 31st March, 2022) ? Vue d’ensemble des flux et encours des fonds actifs et passifs domiciliés dans le monde entier (year to date analysis as of 31st March, 2022)
Pour découvrir le rapport complet,
|
|||||||
| Flows & AuM | All worldwide funds | Global | 2022-09-30 | ||||
|
Êtes-vous intéressé par toutes les informations pour avoir une vision juste des encurs et flux des fonds actifs / passifs domiciliés en Europe (year to date analysis as of 30th September, 2022) ? Vue d’ensemble des flux et encours des fonds actifs et passifs domiciliés dans le monde entier (year to date analysis as of 30th September, 2022)
Pour découvrir le rapport complet,
|
|||||||
| Other | Issues and solutions to build optimal portfolios | ||||||
Special issueFor investors, the decision to allocate to active or passive funds is critical in the context of broad portfolio construction considerations. It’s not an easy choice to make but financial research has proven that, ultimately, allocating efficiently between the two is crucial for portfolio performance. |
|||||||
| Performances | China Large-Cap funds | Asia | Large caps | 2022-09-30 | |||
Outperforming Portfolio Compass - China Large-Cap equity Active & Passive fundsÊtes-vous intéressé par toutes les informations pour avoir une vision claire de l'allocation de fonds actifs/passifs pour China Large-Cap funds (year to date analysis as of 30th September, 2022) ? Notre analyse est la seule à mettre en évidence les indicateurs clés qui donnent une image fidèle de l'environnement actuel des fonds actifs / passifs. Nous sommes également les premiers à pouvoir fournir une recommandation d'allocation de fonds actifs/passifs sur China Large-Cap funds Pour une vue équitable et une décision efficiente. Current year to date key indicators
Source: Morningstar and BSD Investing data from 30 September 2012 to 30 September 2022. Past performance is no guarantee of future results.
Pour découvrir le rapport complet,
|
|||||||
| Performances | China Large-Cap funds | Asia | Large caps | 2021-12-31 | |||
Outperforming Portfolio Compass - China Large-Cap equity Active & Passive fundsÊtes-vous intéressé par toutes les informations pour avoir une vision claire de l'allocation de fonds actifs/passifs pour China Large-Cap funds (yearly analysis as of 31st December, 2021) ? Notre analyse est la seule à mettre en évidence les indicateurs clés qui donnent une image fidèle de l'environnement actuel des fonds actifs / passifs. Nous sommes également les premiers à pouvoir fournir une recommandation d'allocation de fonds actifs/passifs sur China Large-Cap funds Pour une vue équitable et une décision efficiente. Current yearly key indicators
Source: Morningstar and BSD Investing data from 31 December 2011 to 31 December 2021. Past performance is no guarantee of future results.
Pour découvrir le rapport complet,
|
|||||||
| Performances | China Large-Cap funds | Asia | Large caps | 2022-06-30 | |||
Outperforming Portfolio Compass - China Large-Cap equity Active & Passive fundsÊtes-vous intéressé par toutes les informations pour avoir une vision claire de l'allocation de fonds actifs/passifs pour China Large-Cap funds (year to date analysis as of 30th June, 2022) ? Notre analyse est la seule à mettre en évidence les indicateurs clés qui donnent une image fidèle de l'environnement actuel des fonds actifs / passifs. Nous sommes également les premiers à pouvoir fournir une recommandation d'allocation de fonds actifs/passifs sur China Large-Cap funds Pour une vue équitable et une décision efficiente. Current year to date key indicators
Source: Morningstar and BSD Investing data from 30 June 2012 to 30 June 2022. Past performance is no guarantee of future results.
Pour découvrir le rapport complet,
|
|||||||
| Performances | China Large-Cap funds | Asia | Large caps | 2022-12-31 | |||
Outperforming Portfolio Compass - China Large-Cap equity Active & Passive fundsÊtes-vous intéressé par toutes les informations pour avoir une vision claire de l'allocation de fonds actifs/passifs pour China Large-Cap funds (yearly analysis as of 31st December, 2022) ? Notre analyse est la seule à mettre en évidence les indicateurs clés qui donnent une image fidèle de l'environnement actuel des fonds actifs / passifs. Nous sommes également les premiers à pouvoir fournir une recommandation d'allocation de fonds actifs/passifs sur China Large-Cap funds Pour une vue équitable et une décision efficiente. Current yearly key indicators
Source: Morningstar and BSD Investing data from 31 December 2012 to 31 December 2022. Past performance is no guarantee of future results.
Pour découvrir le rapport complet,
|
|||||||