Can we further discuss an ESG factor in light of its underperformance in 2022? How have ESG indices performed year to date in 2023, and what factors contributed to their performance? How has this influenced fund flows? Did the trend of transitioning to environmentally friendly portfolios persist in 2023? We delve into addressing these inquiries within this article, providing comprehensive insights into the ESG (sustainable) market structure for both equity and fixed income assets, distinguishing between index and non-index funds. This article is part of our latest ESG Break for Q3 2023, our quarterly newsletter on ESG for institutional investors.
Can we continue talking about an ESG factor following 2022 underperformance?
Previously on the ESG Break
In our previous ESG Break, a quarterly newsletter dedicated to ESG investing, we explored the historical performance of ESG investments to examine the existence of an ESG risk factor and the potential for a related premium. We also questioned the consistency of the ESG investing trend. To do so, we analyzed equity returns in three main regions: the U.S., Europe, and Emerging Markets. For the sake of comparability, we assessed the over/underperformance of MSCI SRI indices in comparison to their traditional MSCI counterparts.
Our findings aligned with the conclusions drawn by Leila Bennani et al in “How ESG Investing Has Impacted Asset Pricing in the Equity Market,” which indicated that ESG had evolved into a significant risk factor in the Eurozone, with a lesser impact in the U.S. The study noted, ‘ESG helps to enhance the diversification of multi-factor portfolios in the Eurozone. In North America, the results are ambivalent.’
We have enhanced our analysis by incorporating year-to-date figures up to August 2023 to explore any potential changes, leading to some intriguing results.
Global Outperformance Trend
Throughout the first half of 2023, seven out of the ten flagship MSCI ACWI Climate and ESG Indices outperformed their parent benchmark, the MSCI ACWI Index. The remaining three indices underperformed the MSCI ACWI Index by 0.20% or less (Climate and ESG Indexes in Focus: Let’s Get Specific). However, these figures may hide significant regional variations.
U.S. Takes the Lead
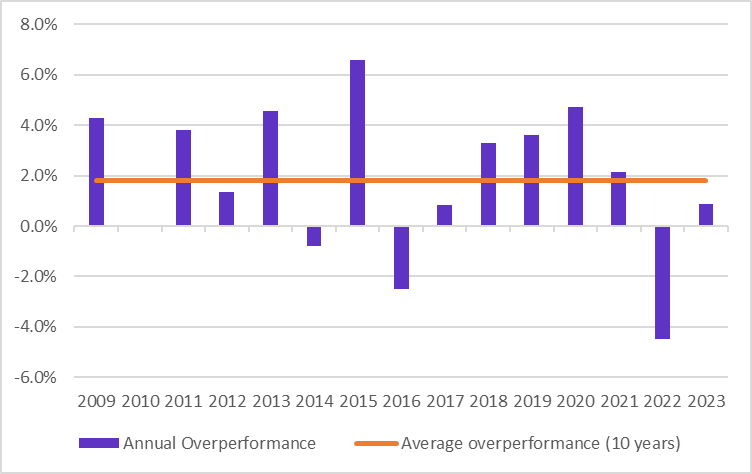
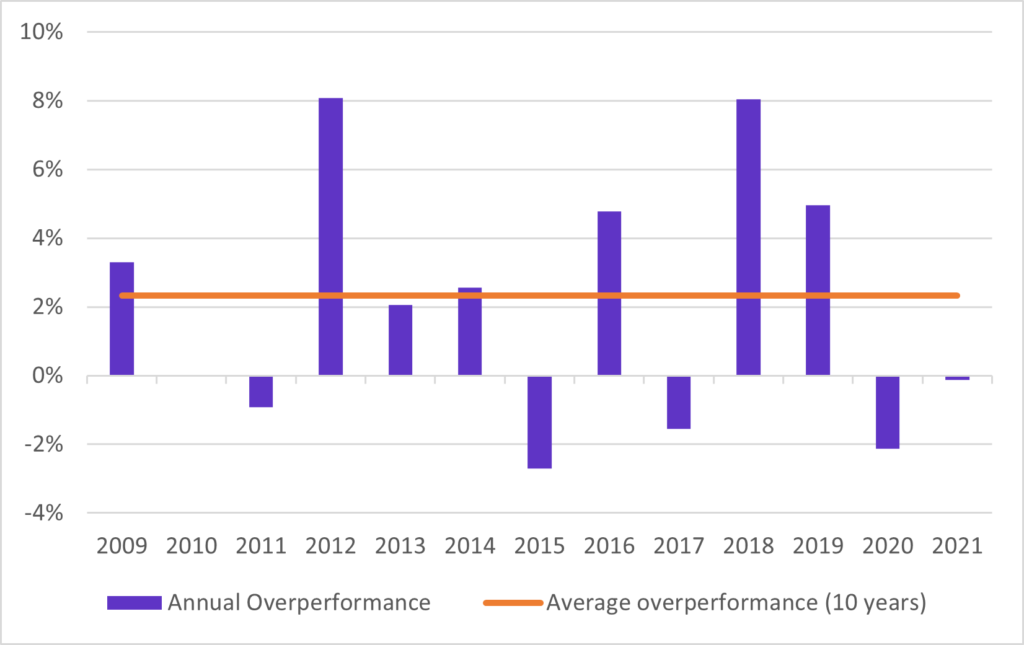
As evident from the following charts, SRI indices are rebounding from their 2022 underperformance, with Europe converging back to the mean at a swifter pace. Until August 18th, 2023, Europe SRI outperformance stands at approximately 1%, while Emerging Markets SRI outperformance remains flat. Both regions have witnessed minimal changes in the past few months, compared to our earlier findings in May of the same year.
Annual Outperformance: MSCI Europe vs MSCI Europe SRI
Annual Outperformance: MSCI EM vs MSCI EM SRI
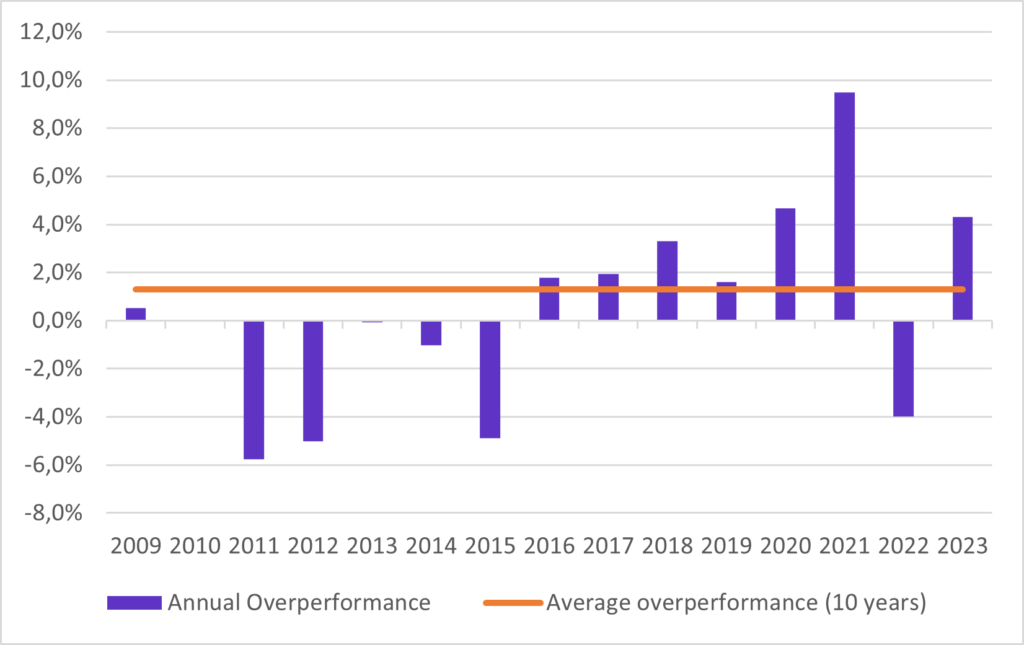
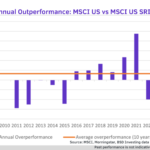
Thus, the story is not the same for U.S equities with SRI index outperformance exceeds 4%.
Annual Outperformance: MSCI US vs MSCI US SRI
What are the drivers ?
The primary drivers behind this outperformance were the positive returns of securities in the information technology and consumer discretionary sectors, along with negative returns in the energy sector. SRI indices were substantially overweight in the Information Technology sector and notably underweight in the Energy sector, as illustrated below.
Average active sector weights of flagship MSCI ACWI ESG Indexes
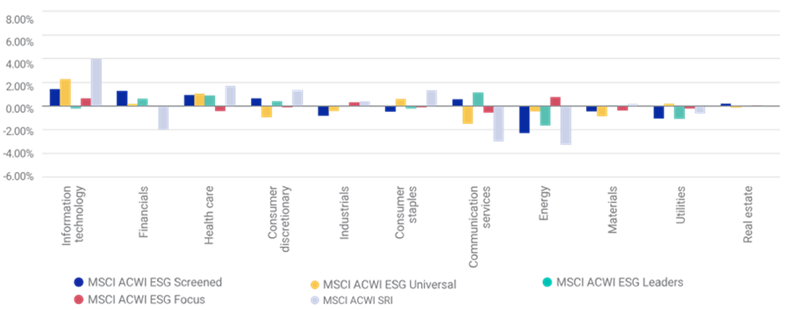
The pronounced overperformance of the U.S. SRI index since the beginning of the year (up to August 2023) becomes evident, as information technology reaped the benefits of investors’ anticipation of a Fed pivot. The technology index (NASDAQ) outperformed its major competitor, the S&P 500, by double the performance.”
ESG Investment at the crossroads: Did the greening of portfolios continue in 2023?
Sustainable funds are recovering part of their 2022 underperformance. Yet ESG ratings providers have also come under scrutiny over the past several months by regulators globally over the transparency and consistency of their ratings.
- How have sustainable funds flows been impacted by such environment so far in 2023?
- Do investors favour sustainable index or non-index fund?
- Are there some differences in flows between asset classes?
- Is the structural rotation of portfolios toward green investments put in question?
Have flows toward ESG funds been impacted by ESG indices performances?
Europe sustainable funds dominate the flows so far in 2023.
Sustainable fund flows have continued to dominate the flows in 2023, reaching €55bn, i.e 57% of total flows in a global context of overall flow rebound. This may be explained by improving performances of sustainable indices in all areas with the US leading the way, Europe not far and Emerging markets on their way to recovery, as detailed above.
Sustainable fund flows have continued to dominate the flows in 2023, reaching €55bn, i.e 57% of total flows in a global context of overall flow rebound. This may be explained by improving performances of sustainable indices in all areas with the US leading the way, Europe not far and Emerging markets on their way to recovery, as detailed above.
Yet the overall trend toward sustainable fund flows is decelerating with major differences between asset classes. 2023 sustainable fund flows represent less than 44% of 2022 flows in more than half of the year.
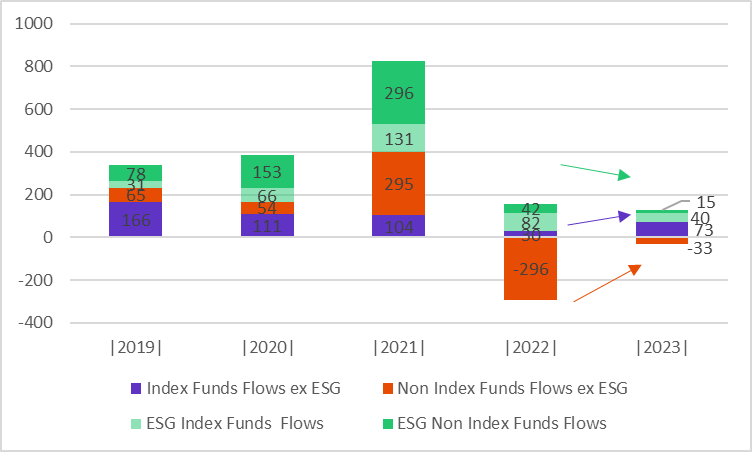
Annual flows to all index and non-indexfunds in Europe
Do investors favour index or non-index fund for sustainable investments?
Index funds have become the preferred vehicle for sustainable investments so far in 2023.
Index funds have become the preferred vehicle for sustainable investments so far in 2023.
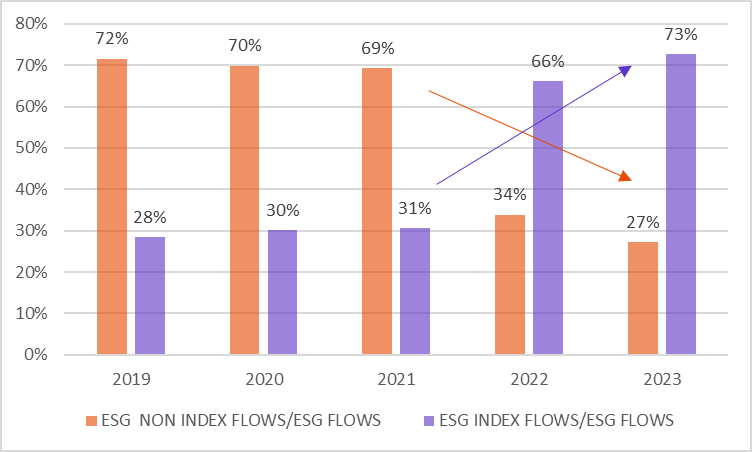
•In 2023 (see graph below), index funds gathered most sustainable fund flows. The shift occurred in 2022 and is confirmed in 2023 while previously non index funds flows were preferred for sustainable investments.
•This holds true for both equity and fixed income index funds. This may be explained by the investors’ appetite for custom ESG indices to meet their investment principles or by the interest toward PAB benchmarks.
% of index and non-index fund in ESG funds flows in Europe
What share of index funds flows does sustainable funds represents?
Sustainable index fund flows represent no more than a third of total index funds flows
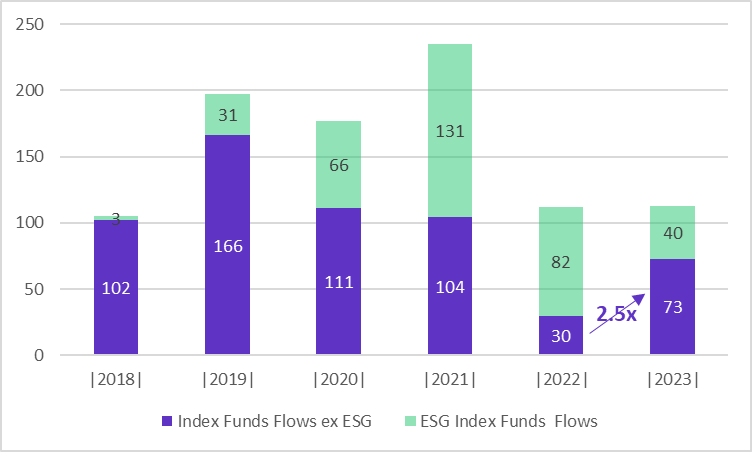
• Year to date in 2023, flows to non-sustainable index funds exceed those to sustainable funds, up 2.5x vs 2022 level. After four years of uninterrupted growth, the share of ESG index funds decreased significantly in 2023, reaching 35% of flows into index funds.
• This may be an indication that in current volatile and uncertain environment, investors use index funds as a tactical tool.
Sustainable & Non sustainable index funds flows in Europe
Are there some differences in flows between asset classes?
In Equity, sustainable fund flows stand out
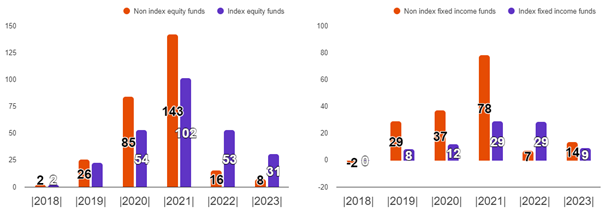
Despite a strong rebound, flows toward equity non index funds continue to be negative of €30bn. Yet flows toward ESG equity non index flows are positive of €8bn.
Equity sustainable fund flows mainly concern index funds
Equity sustainable index funds gathered 79% of all inflows toward equity European domiciled sustainable funds, year to date inflows towards index funds on Paris Aligned Benchmark represent 24% of total equity sustainable index funds flows.
In fixed income, the share sustainable funds flows decreased
ESG funds flows gathered €23bn so far in 2023, less than 20% of total flows. This is the lowest level in total flows since 2020.
The share of sustainable index fund flows in total fixed income index fund flows decreased from 46% in 2022 to 15% in 2023. The decision of S&P to remove ESG Indicators from Credit Rating Reports and questioning on ESG credit risk rating by regulators may explain part of the decrease.
Fixed income non-index fund flows exceed those of indexed funds
ESG non index funds flows were higher than those towards index funds, opposite to what happen in the equity space: €14bn vs €9bn. Investors favoured non index funds in a less changing interest rate environment as opposed to 2022 where a more tactical positioning through index funds was favoured by investors.
Yearly sustainable index vs non-index fund flows
Conclusion
So far in 2023, sustainable funds dominate the flows confirming the continuation of the structural rotation of portfolios toward sustainable investments. Yet the trend is slowing despite the improvement of sustainable fund performances as the regulatory environment could become more demanding for ESG ratings providers.
In the Equity space, sustainable fund flows stand out and are mainly dedicated toward index funds which have become the preferred vehicle for equity sustainable investments so far in 2023. With the recent revival of sustainable equity funds outperformance, investors using sustainable index funds for more tactical purpose (to benefit from an outperformance for example) reappeared in the market in the second half of 2023. Thus, explaining the dominance of index funds in this area.
In the fixed income space, the share of sustainable funds in total flows reached a low point, and non-index fund flows exceed those of index funds so far in 2023. Index funds flows were certainly impacted by questioning on ESG credit risk rating by regulators. This can be added to the fact that Investors favored non index funds in a less changing interest rate environment as opposed to 2022 where a more tactical positioning through index funds was favored by investors.
Marlene Hassine Konqui & Ahmed Khelifa, CFA


Leave a Reply
You must be logged in to post a comment.