How did factor strategies perform in 2023? Are the valuations of these factors still attractive? Are Smart Beta strategies still an important pillar of investors’ portfolios in 2023? Which strategies are experiencing the most significant inflows? What is the role of smart beta strategies in investors’ portfolios?
Factor Analysis for Q1 2023
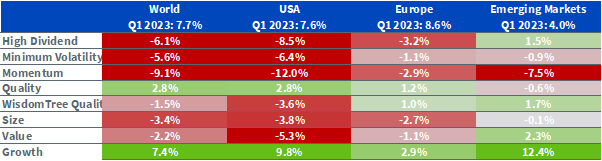
Equity markets began 2023 with positive performance across regions, mirroring the previous year’s closing. However, investors faced challenges as tighter monetary policies started impacting the most vulnerable banks, leading to their decline. The MSCI World index gained 7.7% during the quarter, with Europe performing the best at +8.6%. Emerging markets lagged behind other regions, with a +4% return.
A Swing Quarter:
Overall, factor investing in developed markets faced relative difficulty during this period. In January, markets performed strongly, anticipating a central bank pivot and looser monetary conditions. February’s performance was more subdued in response to hawkish rhetoric from central bankers. In March, Silicon Valley Bank and Signature Bank declared bankruptcy, and Credit Suisse was acquired by UBS. This “banking crisis” increased volatility and significantly shifted rate expectations toward a dovish stance, resulting in another month of positive performance.
- Growth stocks performed the best in Q1 across all geographies, rebounding from a challenging 2022.
- Quality was the second-best performing factor in developed markets for the quarter, benefiting from its resilience in periods of high volatility and uncertainty.
- Value, High Dividends, and Min Volatility factors in developed markets suffered from the changing regimes.
- In emerging markets, Value and High Dividend factors continued to deliver some outperformance.
Equity factor outperformance in Q1 2023 across regions
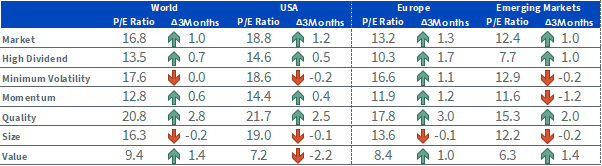
Valuations Continued to Rise in Q1
In Q1 2023, market valuations continued to increase across regions following positive performance. However, in developed markets, while Quality and Value became more expensive faster than the overall market, Small Caps and Min Volatility became cheaper. In the US, Value factors became even cheaper, with a current P/E ratio of only 7.2. In emerging markets, Momentum also became significantly cheaper. Overall, the most defensive factors, Min Volatility and Quality, are currently the most expensive on a relative basis.
Historical evolution of price to earnings ratios of equity factors
Winter is Coming: How Factors Performed in the 12 Months Following the End of the Last 7 Fed Rate Hike Cycles
The timing of the Fed’s pivot will be one of the main factors influencing equity performance. As economies decelerate, recession fears grow, and inflation slows down, central banks will need to plan for a landing, whether soft or not. Such periods of monetary policy changes are challenging for equity investors, and it is valuable to examine similar periods in the past to inform our current positioning.
How factors performed in the 12 months following the end of the last 7 Fed rate hike cycles?
The following article by Pierre Debru, Head of Quantitative Research and Multi-Asset Solutions at WisdomTree Europe, provides insights into how factors performed in the 12 months following the end of the last 7 Fed rate hike cycles : Looking back at Equity Factors in Q1 2023 with WisdomTree.
Professor Jeremy Siegel, WisdomTree Senior Economist, shares his views on inflation, recession risks, Fed policy, and their impact on factors in another article.
Smart Beta Flow & AUM Analysis for 2023
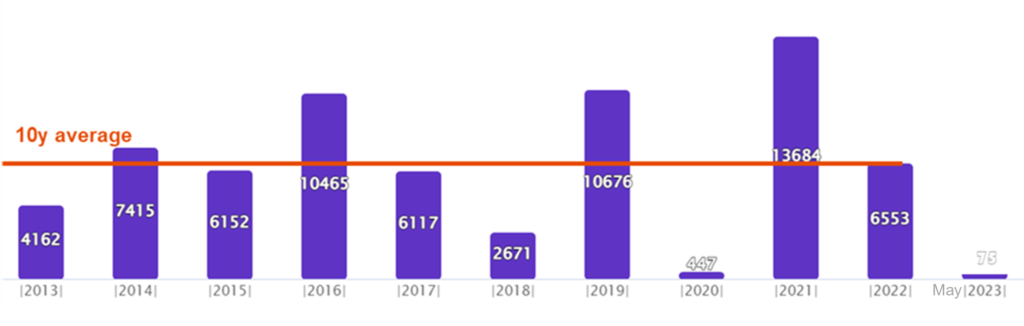
A Difficult Year So Far for Flows Toward Smart Beta Strategies
In 2023, flows toward Smart Beta strategies have been limited in developed countries due to the challenging factor investing context mentioned earlier. However, 2022 saw sustained flows in line with the 10-year average. Over the past decade, Smart Beta flows have been relatively consistent every year, except for a few exceptional years like 2020.
Yearly smart beta flows in Europe
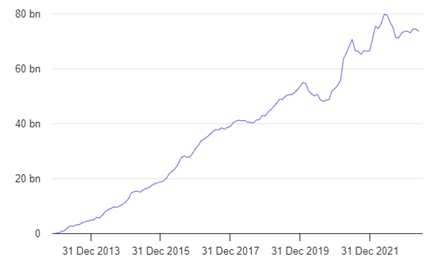
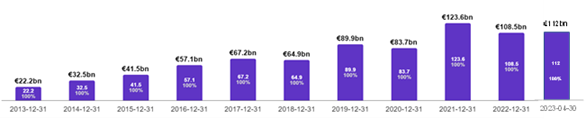
Nonetheless, flows toward smart beta strategies have grown steadily over the long term.
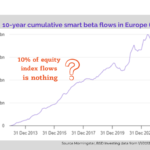
Cumulatively, over the past 10 years, Smart Beta flows have shown sustained growth, reaching €75bn. This represents 9% of total equity index flows over the same period.
10-year cumulative smart beta flows in Europe (€)
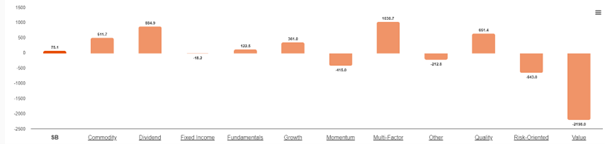
Which strategies are the flows heading towards? Winners and Losers
So far, 2023 has been a year of stark contrasts with significant outflows from the value factor whereas Multifactor, dividend and quality factors are seeing net inflows. The significant outflows from the value factor can be attributed, as mentioned earlier, to underperforming value factor strategies that have been impacted by changing investors’ expectations. Quality and dividend factors on their side continued to be favored by investors looking for resilience in periods of high volatility and uncertainty. Discover here two different examples of dividend strategies: WisdomTree Quality Dividend Growth video, and the Franklin Templeton UCITS ETF European Dividend &https://ad.doubleclick.net/ddm/clk/560169461;369274303;k the Franklin Templeton UCITS ETF Global Dividend.
Excluding value factor outflows, the inflows towards all other factors amounted to €2.3bn, consistent with the long-term average flows.
Smart Beta flow breakdown by strategies year to date in 2023
What Place Does Smart Beta Have in Investors’ Portfolios in 2023?
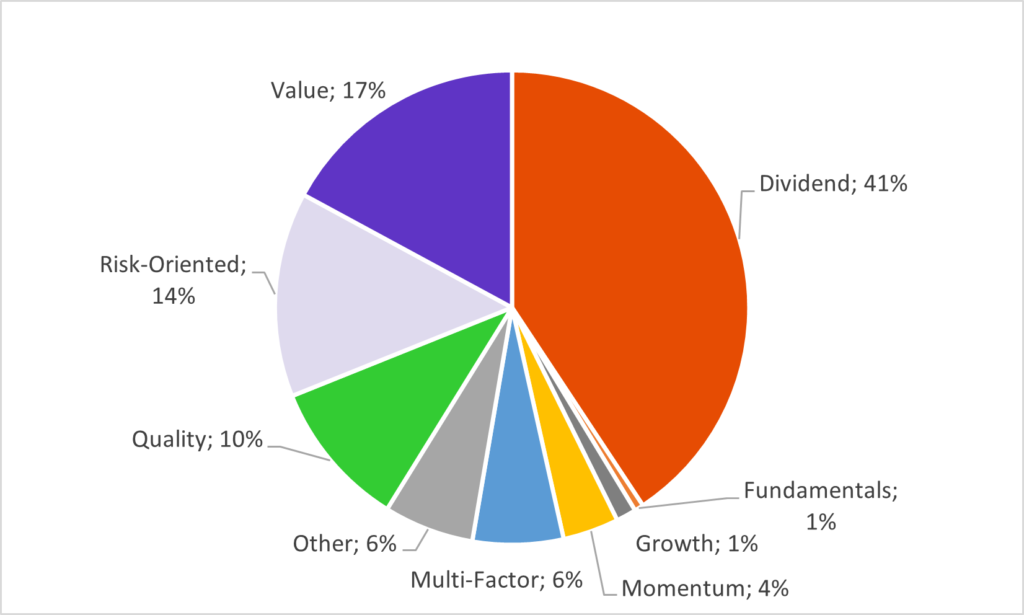
The position of Smart Beta in investors’ portfolios has remained relatively stable over the past 5 years, with Smart Beta strategies accounting for 9% of total assets invested in equity index funds. This confirms that Smart Beta strategies are not merely a passing fad but are consistently used as complementary components in portfolio construction.
Smart Beta strategies Assets under Management over 10 years
Looking into details, dividend factor strategies have attracted the most assets, representing 40% of total Smart Beta AUM in Europe. Dividend strategies have been particularly popular among investors, especially in the turbulent environment of 2022.
Value factor strategies rank second, comprising 17% of total assets, followed closely by risk-oriented strategies.
Investments in multifactor strategies account for 6% of the total, supported by academic research (See our previous article on the topic: What role for Smart Beta in portfolio construction?) demonstrating that diversification across factor exposures significantly improves portfolio sharpness ratio and risk-return trade-off.
Smart Beta assets under management breakdown by strategies
Conclusion
Despite the challenges faced in terms of performance and flows, Smart Beta strategies have consistently represented 9% of total assets invested in equity index funds. This confirms their enduring relevance and dispels the notion that they are a passing trend. Smart Beta strategies continue to be used as both complementary components in portfolio construction and as a mean to enhance portfolio returns through multifactor exposure.
Marlene Hassine Konqui & ahmed.khelifa@lallocataire.com


Leave a Reply
You must be logged in to post a comment.