Active ETFs (aiming to outperform their benchmark) have been gaining popularity since the beginning of the decade. Active semi-transparent, transparent ETFs, how to navigate through them? Where will the growth come from in the coming years in Europe? After a particularly successful year in 2022, what is the position of active ETFs in portfolios worldwide in 2023? What trend do European portfolios follow? Flows towards traditional active management have been declining for several years, does this mean that investors have deliberately chosen to prioritize passive investments? The proliferation of new types of ETFs (active, smart beta, factor-based, thematic, ESG…) that involve active decision-making within the index has blurred the line between active and passive investments. What is the true place of active & passive strategies in investors’ portfolios?
Active semi-transparent, transparent ETFs, how to navigate through them?
Semi-transparent ETFs: A powerful yet limited tool
Implementing an active strategy in the form of an ETF can be a real challenge for fund managers. The emergence of a new ETF format, semi-transparent ETFs, addresses this need by offering undeniable advantages that traditional ETFs do not possess.
In 2019, the SEC gave the green light for the emergence of a new ETF format, the semi-transparent ETF. This format is only available in the U.S. market and does not exist in Europe, as ESMA has not yet ruled on the matter. To understand this new format, it is necessary to first understand the usual format of ETFs, which is fully transparent. The rationale behind semi-transparent ETFs will then be easier to grasp.
Requirements of fully transparent ETFs:
One of the main requirements for ETFs is to disclose their daily holdings, allowing them to be valued throughout the day. This is one of the major differences between a traditional fully transparent ETF and a comparable mutual fund. Disclosing trading activity to the market while positions are still being built or reduced could increase front-running and hinder cost-reducing trading strategies, resulting in a deterioration of net performance. Opportunistic or algorithmic trading strategies could further reduce trading costs for actively managed ETFs that are not required to disclose their positions daily. ETFs that do not need to disclose their holdings daily can benefit from the opportunity to implement trading strategies that preserve the potential value of active management for shareholders. It may be the case that portfolio managers generally do not want to disclose their next portfolio move for fear of front-running (i.e., a third party identifies and executes the same transaction just before the fund does), which is why actively managed equity ETFs have not proliferated to the same extent as passively managed ETFs.
A winning move:
Investors have more choices after the SEC’s approval in 2019 of semi-transparent active ETFs that allow fund managers not to disclose their full holdings daily, resulting in an increase in the number of such ETFs brought to market. This decision applies to a restricted set of asset classes and a limited number of managers and is not universal at all. This new format adds the traditional advantages of ETFs to actively managed strategies, namely:
Potentially lower costs compared to a comparable mutual fund:
The structure of an actively managed ETF can allow it to have lower fees than a comparable mutual fund.
Tax efficiency, primarily in the United States:
The creation and redemption process of ETF shares can make them more tax-efficient than a comparable mutual fund, as the process could be done “in-kind,” which is not a taxable event.
Flexibility and liquidity:
Like index ETFs, actively managed ETFs allow investors to trade throughout the day, including short sales and margin purchases. This can also provide greater ETF liquidity compared to funds that are not traded throughout the day.
Of course, traditional actively managed ETFs have drawbacks. Here are some of them:
Daily disclosure requirement:
This can be a problem for large funds as well as funds holding illiquid securities. Full disclosure can prevent active managers from making adjustments and implementing a research-driven investment strategy in the portfolio due to concerns about front-runners and other market participants. It should be noted that semi-transparent ETFs help avoid this pitfall.
Deviation from net asset value:
Traditional actively managed ETFs can develop significant premiums or discounts compared to net asset value during volatile trading days. These ETFs can exhibit larger premiums or discounts compared to net asset value than passively managed ETFs.
Higher costs compared to certain funds:
While actively managed ETFs may have lower costs than comparable mutual funds, they may have higher expense ratios than index ETFs.
Semi-transparent ETFs are an ideal vehicle for asset managers looking to increase net inflows for existing or new actively managed investment strategies. They offer fund managers the opportunity to establish positions without the risk of front-running and to bring these strategies to market through a more liquid and cost-effective vehicle. Currently, this opportunity is limited to U.S.-domiciled funds for specific securities, with most asset categories excluded from this possibility.
The next country to allow semi-transparent ETFs within a broader range of asset categories will benefit from this trend. In 2023, a survey conducted among 549 investors and professional advisors deploying nearly $900 billion across their ETF strategies worldwide revealed that 80% of U.S. respondents would be more inclined to invest in an active strategy if it were presented in the form of an ETF rather than a mutual fund (Global ETF Survey 2023, Trackinsight). Therefore, we could witness a rapid and significant migration of asset managers to the next country with ETF-friendly semi-transparent regulations.
What is the place of Active ETFs in investors’ portfolios?
What share do active ETFs have in portfolios worldwide?
Active ETFs (aiming to outperform their benchmark) are not new, but are gaining particular prominence, especially in the United States. In total, these active ETFs represent 6% of total ETF assets worldwide, primarily in the United States. Among bond ETFs, active ETFs account for 10% of assets. Over the past two years, there has been an acceleration of flows into this type of ETFs. At the end of the first half of this year, active ETFs accounted for 22% of global ETF flows, compared to less than 16% in 2011 and less than 4% five years ago. In terms of equities, active ETFs represent over 26% of ETF flows. This acceleration of flows confirms investors’ appetite for active ETFs and should lead to stronger weight in investors’ portfolios.
What is the trend for European portfolios?
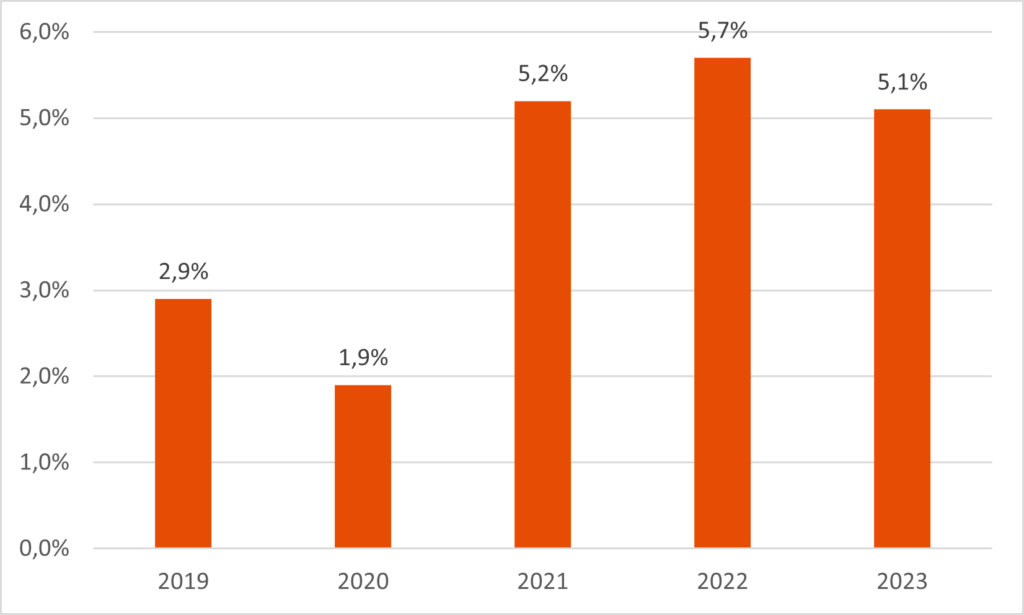
In Europe, active ETFs still represent only 2% of total ETF assets. In H1 2023, they captured nearly 5% of ETF flows, whereas they were almost non-existent in 2018, as shown in the graph below. For equities, active ETFs represent 9% of 2023 ETF flows.
Share of active ETFs in ETF flows since 2019
What is the true place of active strategies in investors’ portfolios?
As explained in Ahmed Khelifa’s article “Active ETFs in Europe: Mirage of the Best of Both Worlds or Unknown Reality? The Truth Is Elsewhere”, given the proliferation of new types of ETFs, academic research shows that there are many more active ETFs than commonly believed. In fact, it defines two types of active ETFs: those active in form (with components differing from the index) and those active in function (tracking a specific market segment or factor). In the latter case, the active investment decision lies at the index level, where the composition will differ and vary based on rebalancing, resembling more of an active investment in function. Active ETFs should thus include both types of ETFs.
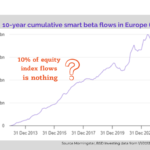
If we have described the share of active ETFs in form above, what about the share of active ETFs in function within investors’ portfolios? This notably includes smart beta strategies, ESG strategies, or thematic strategies. Each of these strategies involves an active allocation decision and aims to outperform traditional indices. For confirmation, ESMA in its annual report on performance (ESMA Annual Statistical Report, Performance and Costs of EU retail Investment Products 2022) considers factor-based and sector-based strategies as active investments.
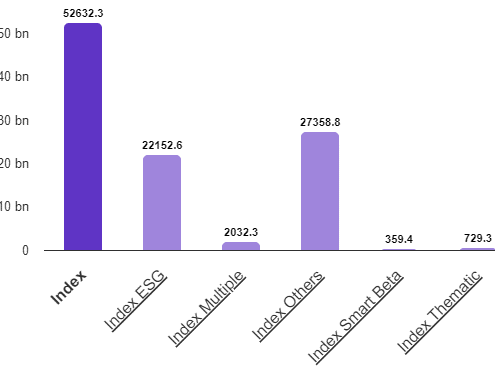
Within equity index funds, 51% of flows go to traditional passive index funds, and 49% go to ESG, smart beta, and thematic index funds, as shown in the graph below.
Flows to equity index funds – H1 2023
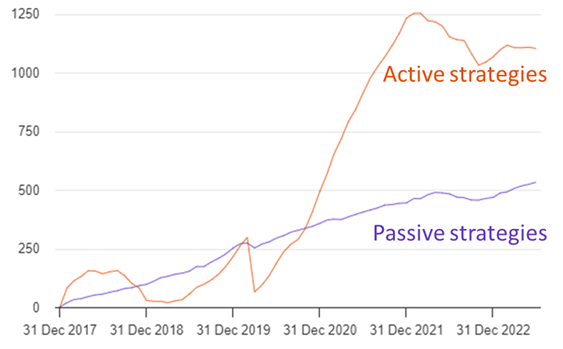
Overall, over the past five years, flows into active strategies (as defined in the preceding paragraph) represent 67% of total flows, compared to 43% when using the strict commonly accepted market definition. For equity funds, it is 69% of flows compared to 25% with the strict definition over the five-year period.
Flows to active and passive strategies in Europe over the past five years
Conclusion
The rise of active ETFs, whether in form or even in function, demonstrates investors’ appetite for active strategies aiming to outperform the benchmark. The next country to allow semi-transparent ETFs within a broader range of asset categories will benefit from this trend. Additionally, far from invalidating the role of active management, this confirms the importance of both active and passive management styles in generating performance within portfolios.
Marlene Hassine Konqui & Ahmed Khelifa, CFA









Leave a Reply
You must be logged in to post a comment.