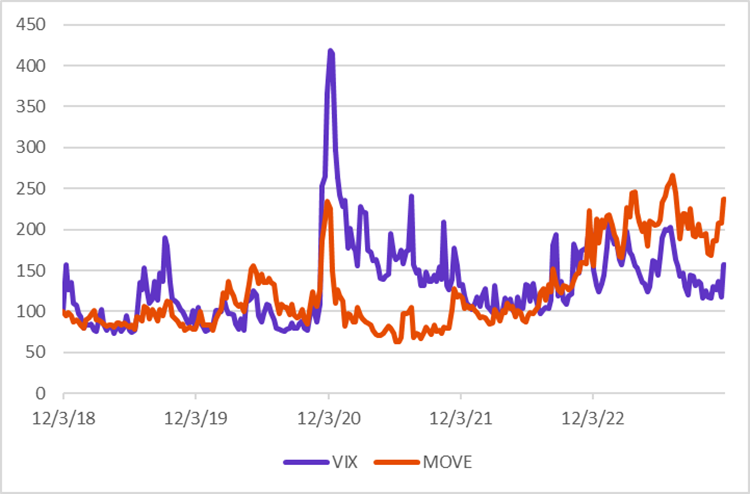
US bond market volatility as measured by the MOVE index “Merrill Lynch Option Volatility Estimate” that measures U.S. interest rate volatility is hitting a 5-year high expressing investors uncertainty regarding future interest rates. What can this mean from an asset allocation perspective? Is there any predictive power on bonds expected returns?
Bonds and Equity Market Volatility
In their Working paper “Market volatility, monetary policy and the term premium”, Abhishek Kumar and al assert that changes in the long-term interest rate are not driven only by changes in the expected path of future short-term interest rates, as assumed by mainstream macroeconomic theory, but also by changes in the term premium. They also show that “while it may be tempting to assume that only a measure of expected bond volatility matters for the term premium, the VIX may also be empirically relevant. For one, investors may hold diversified portfolios of bonds and equities. They may therefore rebalance their portfolio when expected returns and perceived risks change.”
Thus, long term interest rates are driven not only by bonds volatility but also by equity volatility.
What a positive equity markets volatility chock means for bond markets:
A positive shock to the VIX, which might reflect an increase in economic uncertainty and/or investors’ risk aversion, reduces the term premium. This is consistent with investors increasing their demand for government bonds as they rebalance their portfolios away from riskier assets.
The positive shock to the VIX also has contractionary and disinflationary effects, which is consistent with the negative impact that greater economic uncertainty should have on economic activity in general.
What a positive bonds markets volatility chock means for bond markets?
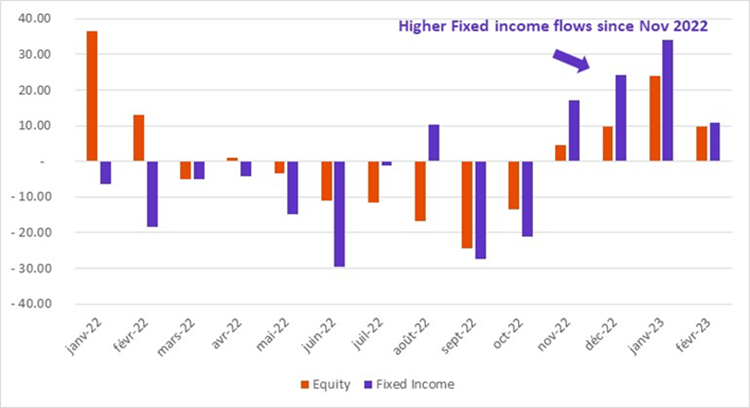
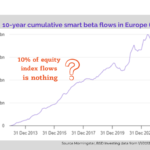
By contrast, a positive shock to the MOVE, which reflects heightened uncertainty about future changes in interest rates, raises the term premium negatively impacting bond prices. According to this assertion, investors should be fleeing bond markets as a bond market volatility shock is taking place in 2023. Then why are investors heavily allocating their portfolios to bonds despite the bond volatility spike and even at a higher pace than the allocation toward equity as shown by Marlène Hassine Konqui in her latest bond market flows analysis (access full article here)?
Equity vs Fixed income index & non index fund flows
Yield Curve is the answer:
United States: Government Bond 10-Year/Two-Year Term Premium
US Yield Curve from 1976 to 2023
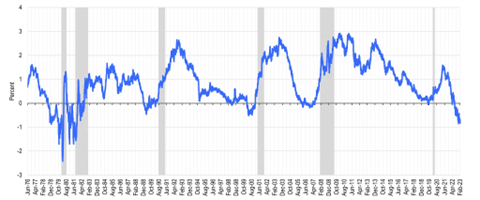
Today, most parts of the US Treasury yield curve (and many foreign government-bond market curves) are inverted, meaning that short-dated deposits, bills and notes offer higher yields than those on longer-dated bonds. While a recession has not followed every instance of an inverted curve, the Federal Reserve (Fed) Bank of Chicago has shown that each time the yield spread between 10-year and two-year Treasuries has inverted since 1969, a recession has followed.
In his LinkedIn Newsletter Global Market Perspectives of the 22nd of February 2023 (access the full article) Stephen Dover, CFA, Chief Investment Strategist, Head of Franklin Templeton Institute, came to an interesting conclusion when answering the two following questions:
- What is the historical impact of an inverted yield curve on equities?
- What is the historical impact on bonds?
Stocks and bonds react differently
Whenever the yield curve is inverted, investors ought to anticipate its normalization. Moreover, as Franklin Templeton research shows (access the full article), US Treasury yield curve normalization typically takes place in the context of falling interest rates, what Wall Street terms a “bull steepening.” In those instances, both short- and long-term interest rates fall, with the front end (shorter-dated maturities) rallying more than the long end.
Unsurprisingly, therefore, a bull steepening is bullish for fixed income markets. Prices rise along the yield curve (and across many credit markets), boosting fixed income total returns in excess of coupon rates.
One might conclude that equity investors would also be pleased with falling interest rates. All else equal, after all, lower interest rates should boost equity valuations. And US bond yields have fallen in recent months, giving stocks a lift despite slowing profits growth. However, history gives us a more nuanced picture. During periods when the yield curve shifts from inverted back to upward sloping, stock markets typically sag. In those same episodes, total returns on bonds top those on equities in absolute and risk-adjusted terms (Exhibit 2).
Exhibit 2: Fixed income and equity returns and Sharpe ratios during periods of yield curve normalization
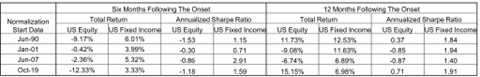
The main reason why investors are heavily investing their portfolios in bond market despite bond market volatility spike is because they are expecting Yield curve normalization in the coming months which may lead to bonds overperformance on absolute and risk adjusted bases relative to equity markets.
Ahmed Khelifa, CFA


Leave a Reply
You must be logged in to post a comment.