2023 wasn’t the best year for ESG ETFs. How do we explain the performance gaps between ESG indices and traditional indices, both in the short term and over a longer cycle? And perhaps more importantly, when considering portfolio allocation, do we always view ETFs as passive management?
Sustainable investments vary in their motivations, implementations, and applications. There is a wide range of approaches with different objectives and profiles. It’s important to note that these approaches are not mutually exclusive. Many sustainable investments incorporate more than one approach, for example, by applying exclusions and limiting ESG risks.
Unlike 2022, when sustainability indices suffered from a lack of exposure to high-carbon sectors, underperformance in 2023 was mainly due to security selection. Members of the “Big Seven,” Meta and Alphabet, faced serious ESG controversies, while Tesla and Amazon presented higher ESG risks compared to their sector peers, leading to their exclusion or underweighting in many ESG risk-focused indices.
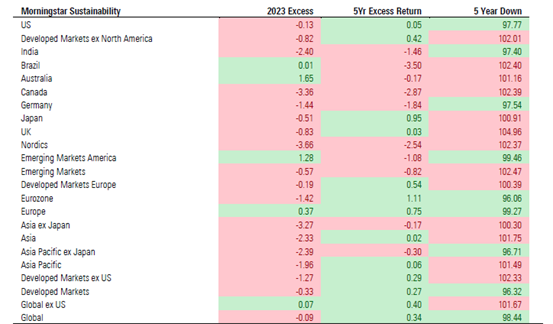
For example, only five out of 23 Morningstar Sustainability indices outperformed in 2023. ( Why Didn’t Sustainable Investments Thrive Amid 2023’s Tech rebound? ).
The top-performing countries are Australia and Europe. Over a five-year period, results are improving, with 13 out of 23 sustainability indices outperforming their benchmarks.
Morningstar Sustainability Indexes Risk/Return Record vs Non-ESG parent Index
However, climate indices, such as those focused on net-zero alignment, had a rebound year due to greater exposure than the market to the technology sector. These indices also benefited from the distancing of high-carbon sectors, which underperformed in 2023.
For instance, six out of eight Morningstar PAB and CTB indices outperformed in 2023. Over the five-year period, all eight outperformed, and seven out of eight lost less than their benchmark during downturns( Why Didn’t Sustainable Investments Thrive Amid 2023’s Tech rebound? ).
Morningstar EU Climate Indexes Risk/Return Record vs Non-ESG parent Index

So, we can draw two conclusions:
1. ESG indices incorporate different deviation choices from the overall market, both in their construction methodologies and in the variety of ESG objectives they pursue. This deviation is an active and deliberate choice that can be considered from the perspective of an asset allocator as active management.
2. ESG indices respond to certain cyclicality and can be managed throughout the cycle so that a “traditional” investor can optimize capturing their outperformance.
Finally, what is the evolution of investor interest in ETFs?
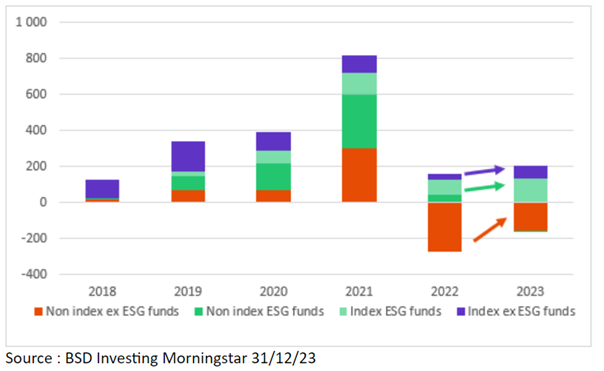
Looking at aggregated equity and bond flows, we notice two things:
1. ESG flows remained positive in both 2022 and 2023 despite performance.
2. Almost all ESG flows were index-based.
Digging deeper into these ESG flows, we find that climate strategies (PAB and CTB) represent 19% of ESG flows. This figure has not changed between 2022 and 2023.
Marlene Hassine Konqui & Ahmed Khelifa, CFA








Leave a Reply
You must be logged in to post a comment.