Can we continue talking about an ESG factor following 2022 underperformance? How ESG indices performed in 2023 year to date and why? What have been the impact on fund flows? Did the greening of portfolios continue in 2023? We answer all those questions in this article and take an in-depth look to ESG (sustainable) market structure both for equity and fixed income assets with a split between index and non-index funds.
Can we continue talking about an ESG factor following 2022 underperformance?
Previously on the ESG Break
In our previous ESG Break, our quarterly newsletter dedicated to ESG investing, we looked at how ESG investments performed in the past in order to see if there is an ESG risk factor with a related premium and whether there is a rationale behind ESG investing craze persistence in the future. To do so, we looked at equity returns in the three main different regions, U.S, Europe and Emerging Markets. For comparability reasons, we choose to look at the over/underperformance of MSCI SRI indices over their traditional MSCI equivalents.
Our findings were consistent with the conclusions of Leila Bennani and al in “How ESG Investing Has Impacted the Asset Pricing in the Equity Market” that shows that in the past ESG became a major risk factor in the Eurozone and less in the U.S “ESG helps to enhance the diversification of multi-factor portfolios in the Eurozone. In North America, the results are ambivalent”.
We upgraded our analysis with year-to-date figures (as of May 2023) to see if things have changed and the results are quite interesting.
Europe and Emerging markets, the way to recovery
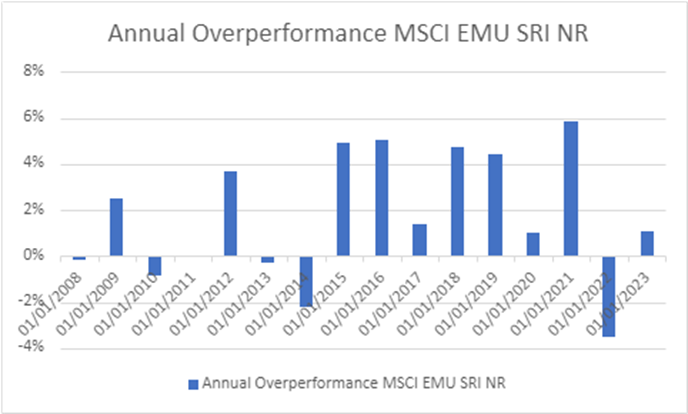
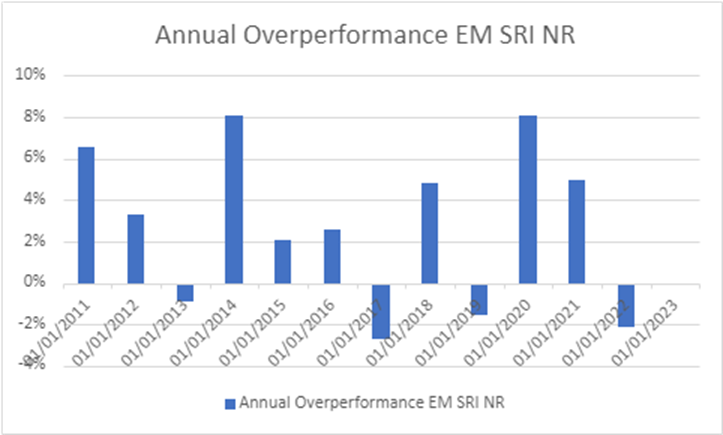
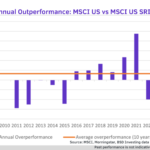
We also found that when looking at the 10 Developed equity Markets countries in the EMU (European Economic and Monetary Union), using MSCI EMU NR LCL and MSCI EMU SRI NR LCL, there’s a significant overperformance –over 2%- of SRI investments over non-SRI ones in average over the last ten years (2013 to 2022) in Europe. This overperformance is even higher for Emerging markets over the same period with an average annual overperformance of 2,3% per year over the last 10 years and a total overperformance of 38%.
As we can see in the following figures, SRI indices are recovering from 2022 underperformance with Europe reverting more rapidly to the mean. Until 09 Mai 2023, SRI EMU overperformance is about 1% whereas The Emerging Markets SRI overperformance is flat.
US, the ESG Breakthrough?
Thus, the story is not the same for U.S equities, the MSCI USA SRI NR LCL significantly underperforms the MSCI USA NR USD over the last 10 years with an average annual underperformance of -0.85% per year over the last decade.
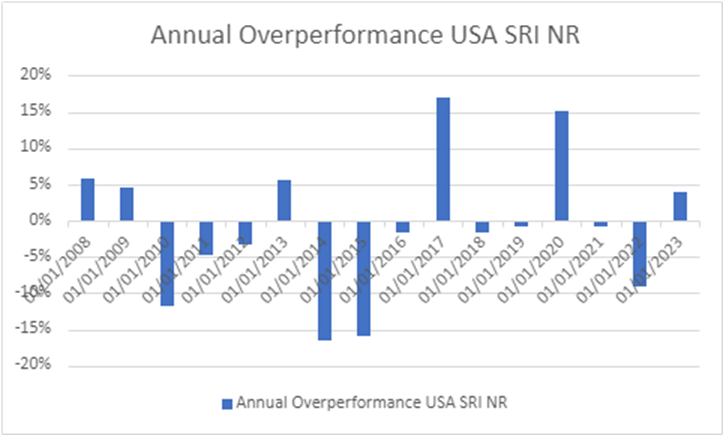
2023 could be the year of SRI breakthrough in the U.S. As we can see in the previous figure, U.S SRI overperformance is as high as 4%. A figure in a complete opposition with its 10 years underperformance.
This is also consistent with the conclusions of Leila Bennani and al in “How ESG Investing Has Impacted the Asset Pricing in the Equity Market” showing that in a forward-looking approach, ESG may be one of the major risk factors in both Europe and the U.S : “The integration of ESG in a factor investing framework is more puzzling. Backward looking, ESG seems not to be a new risk factor in North America whereas ESG could improve the diversification of multi-factor portfolios in the Eurozone. Forward looking, ESG appears to be a very serious candidate to join the very exclusive club of risk factors that explain the cross-section of stock returns.”
MSCI ACWI Climate and MSCI ACWI ESG Indexes’ performance
From a global point of view, according to the latest MSCI research, during the first quarter of 2023, most of the MSCI ACWI Climate and MSCI ACWI ESG Indexes outperformed their benchmarks.
MSCI ACWI Climate and MSCI ACWI ESG Indexes’ performance
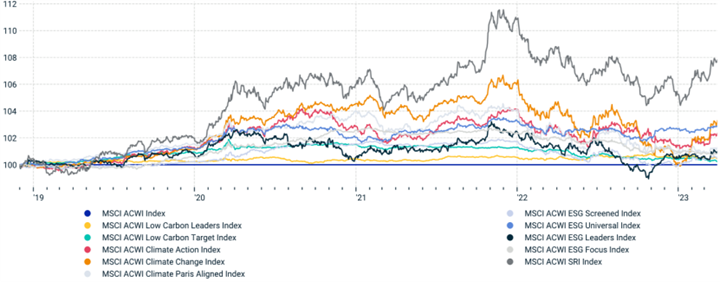
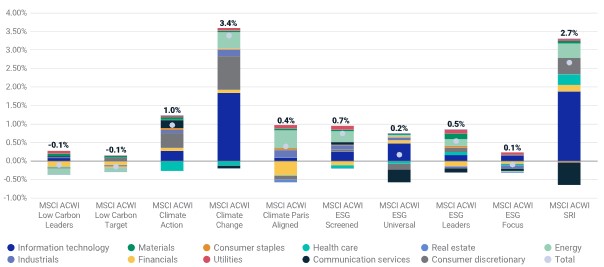
During the first quarter of 2023, the MSCI ACWI Climate Change, MSCI ACWI Climate Action and MSCI ACWI Climate Paris Aligned Indexes outperformed their parent, the MSCI ACWI Index, whereas the MSCI ACWI Low Carbon Leaders and Low Carbon Target Indexes experienced small but negative cumulative active performance. On the other hand, four out of the five flagship MSCI ESG Indexes outperformed the MSCI ACWI Index.
What could explain this turning point?
SRI indices took a double advantage of their sector weights. The main drivers behind this outperformance were positive returns of securities in information technology and consumer discretionary and negative returns in the energy sector as shown in the figure below.
Active-sector-return contribution
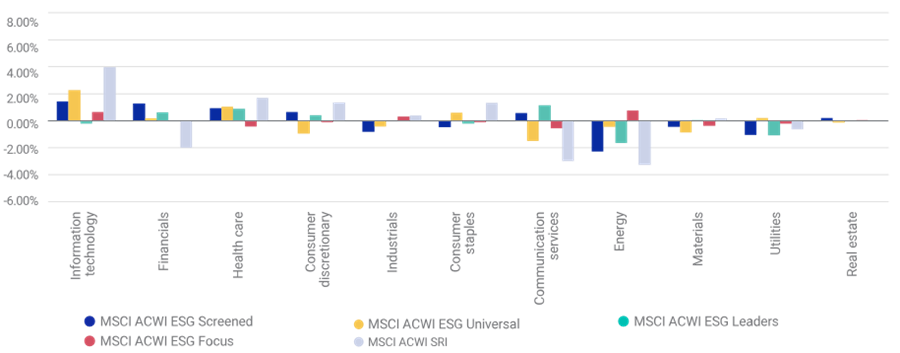
And SRI indices were the most overweight ESG indexes in Information Technology and the most underweight ones in Energy sector, as we can see below.
Average active sector weights of flagship MSCI ACWI ESG Indexes
U.S SRI important overperformance since the beginning of this year (until 05/2023) become obvious then as information technology benefited from investors’ expectation of a FED pivot and technology index (NASDAQ) had twice the performance of its largest competitor S&P500.
ESG Investment at the crossroads: Did the greening of portfolios continue in 2023?
The development of sustainable index and non-index funds has been very rapid over the past years, particularly in 2021. Even, in the uncertain context of 2022, investors have continued to invest in sustainable funds. Yet equity ESG funds underperformed their regular counterparts in 2022, after several years of outperformance (see the first paragraphs of this article for more details). Additionally, many funds have been downgraded from article 9 to article 8 due to regulatory uncertainties.
- Have flows toward ESG funds been impacted by this lack of clarity and this underperformance?
- Do investors favour sustainable index or non-index fund?
- Are there some differences in flows between asset classes?
- Is the structural rotation of portfolios toward green investments put in question?
Have flows toward ESG funds been impacted by 2022 ESG equity funds underperformance?
Share of sustainable fund flows is declining in total (sustainable and traditional) fund flows.
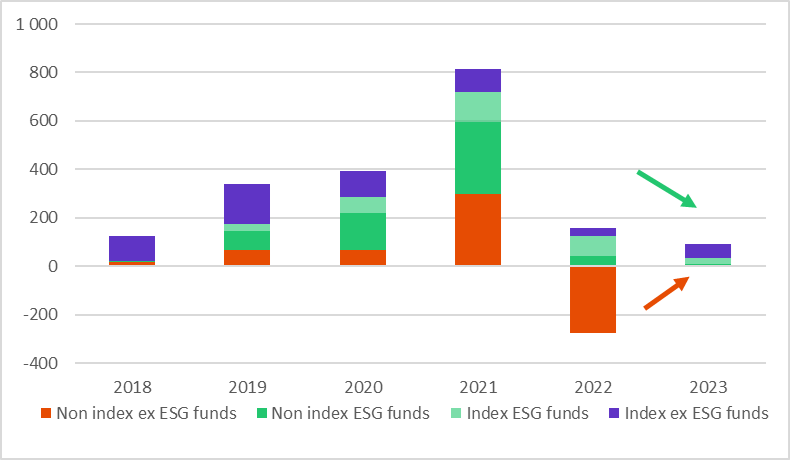
- After 2022 significant outflows, overall flows (sustainable and traditional ones) have rebounded year to date to €92bn.
- Sustainable fund flows, that remained positive during the 2022 market downturn, have continued to be positive in 2023,reaching €34bn. Yet their share in total flows is reduced to 37% probably impacted by both the underperformance in the equity space of sustainable funds and the lack of clarity concerning regulatory requirement in the ESG space.
- Worth noticing that, as Europe & Emerging markets are on their way to recovery and sustainable US equity funds already outperform their traditional counterparts, this trend could reverse during the course of 2023.
Europe domiciled yearly sustainable vs non sustainable fund flows

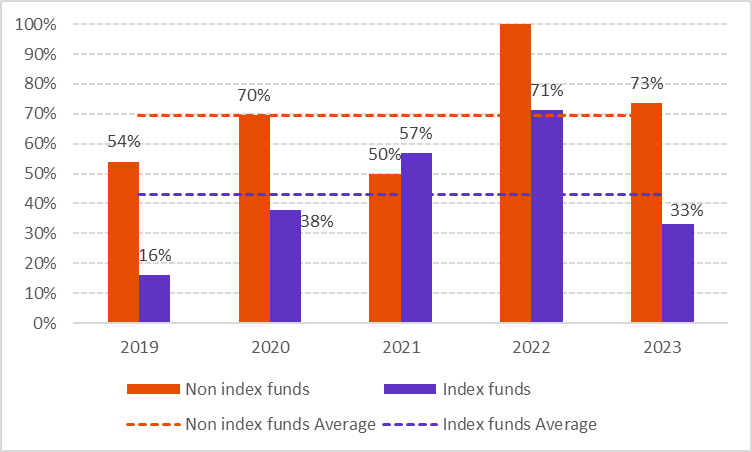
The share of sustainable index fund flows in total index fund flows decreased, while non-index sustainable fund flows represent a higher part of sustainable fund flows in 2023
- Opposite to 2021 & 2022, in 2023 (as of May 2023) the share of sustainable index fund flows in total index fund flows decreased to 33% vs 70% in 2022 (see graph below).
- This holds true for both equity and fixed income index funds. This decline may be explained by the underperformance of sustainable funds in 2022 with investors using sustainable index funds for more tactical purpose (to benefit from an outperformance for example) less active in the market in 2023.
- This does not put in question the structural rotation of portfolios toward sustainable funds as seen in the high percentage of sustainable non index funds in the total of non-index fund flows. This could also reverse if as seen at the beginning of the article, the outperformance recovers.
% of ESG flows in all index and non-index fund flows in Europe
Do investors favour index or non-index fund for sustainable investments?
Sustainable flows to index funds exceed those toward non-index funds YTD
- In the context of strong outflows for non-index funds, in 2022, sustainable index funds flows were superior to non-index fund flows.
- Year to date in 2023, flows to overall sustainable index funds continue to exceed flows to sustainable non-index funds respectively €28bn vs. €6bn. This is in line with overall market trend, where non index flows are below those of index funds: €9bn vs €83bn.
Annual flows to all index and non-index funds in Europe
Are there some differences in flows between asset classes?
In Equity, sustainable fund flows mainly concern index funds
Equity sustainable index funds gathered all inflows toward equity European domiciled sustainable funds, year to date. For example, inflows towards index funds on Paris Aligned Benchmark like the Franklin Stoxx Europe 600 Paris Aligned Climate UCITS ETF or the Franklin S&P 500 Paris Aligned Climate UCITS ETF, represent 14% of total equity sustainable index funds flows.
In fixed income, non-index fund flows exceed those of index funds YTD
- Non index funds gathered €8bn already above 2022 level, and above that of index funds (€6bn).
- Non index funds recover part of their interest in a less changing interest rate environment as opposed to 2022 where a more tactical positioning through index funds was favoured by investors.
- The share of index fund flows in total fixed income sustainable index fund flows decreased from 46% in 2022 to 21% in 2023. Lack of clarity and multiplicity of the offer on different type of benchmarks on the sustainability front may explain part of the decrease.
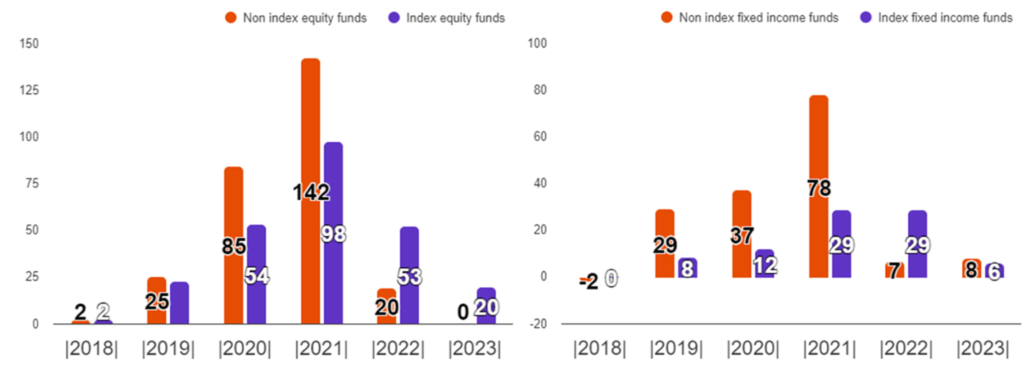
Yearly sustainable index vs non-index fund flows
Equity Fixed Income
Conclusion
The 2022 underperformance of Sustainable funds has significantly impacted sustainable funds flows. Firstly, It can explain the decrease in sustainable funds flows observed year to date. Secondly, it shed some light also on the decrease of the share of Sustainable fund flows in the total of index funds since the beginning of the year, with investors using sustainable index funds for more tactical purpose (to benefit from an outperformance for example) appearing to be less active in the market in 2023. Yet this trend could reverse if 2023 confirms outperformance observed at this beginning of the year. Additionally, this decrease does not put in question the structural rotation of portfolios toward sustainable investments, as demonstrated by the high share of sustainable funds in non-index fund flows.
Marlene Hassine Konqui & Ahmed Khelifa, CFA


Leave a Reply
You must be logged in to post a comment.