Response to SPIVA and MORNINGSTAR
SPIVA and Morningstar are the 2 methodologies generally used to compare the performance of active and passive funds, which Marlene Hassine Konqui, CEO of BSD Investing and member of the SFAF ETF commission, questions in her latest article published by the SFAF (1).In this article, she explains the main biases in these studies.
There are currently two widely used approaches in the market for comparing active and passive performances: SPIVA (‘S&P Indices Versus Active) and Morningstar. Those frequently cited scorecards arrive at the conclusion that most active managers do not outperform passive funds over the long term. In her latest study published in 2022 and titled “Issues and solutions to build optimal portfolios” Marlene Hassine Konqui the associate general manager at BSD Investing and member of the SFAF and ETF commission question those studies’ methodology, often quoted for the comparison of performances between active and passive funds. She demonstrates that their results are closely linked to the hypotheses formulated and that these introduce bias into the performance comparisons of these funds.
The choice of the benchmark: using a broad benchmark vs the prospectus benchmark
The SPIVA active/passive funds’ scorecard compares funds vs an index. Under this approach, active funds are compared with a broad benchmark selected by S&P and not vs the official benchmark of the funds. The Morningstar active/passive barometer compares active funds against the passive funds of the same category. Yet, this could include funds on very different benchmarks such as smart-beta funds.
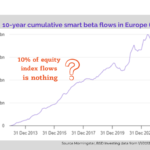
However, within the same category, the indices can have very different performances. In the Europe large-cap category, the performance of the various indices can range from 44% to 346% over 10 years (12/31/2010 and 12/31/2020). The choice of index will have a significant impact on the results.
The treatment of fees, comparing active funds vs indexes or vs passive funds
SPIVA, which publishes its results semi-annually, measures the performance of actively managed funds against that of an underlying index and not vs passive funds. This method ignores the management fees and costs incurred by passive funds. It is wrongly assumed that the performance of passive funds equals the one of the underlying indices (i.e., no cost assumed). This may seem negligible over a short period of time, yet the longer the period studied, the higher the bias introduced when comparing funds.
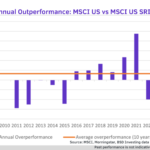
For example, over 10 years, Euro Zone ETFs outperform the EuroSTOXX 50 index by 11% while emerging ETFs underperform the MSCI EM index by 12% (12/31/10-12/31/20 ). The performance of ETFs is therefore not that of indices. Comparing against one or the other will therefore lead to completely different investment conclusions.
SPIVA and Morningstar use a standard method to adjust for survivorship bias
The standard methodology for measuring the success or the failure of active managers is to include all the funds at the beginning of the considered period. However, this leads to biased results, as they are based on the strong assumption that all funds no longer in existence were liquidated due to poor performance. And yet, in many cases, funds are liquidated for non-performance reasons such as funds’ mergers, strategy overlap, manager retirement, lack of scale, or share classes consolidation. Linnainmaa finds that this treatment generates an inverse survivor bias which approximately compensates for the survivor bias
The use of a single indicator between two fixed dates
The prevalent “single date” performance analysis leads to assessing that many active funds do not outperform their benchmarks. This type of analysis does not give a complete and reliable insight into portfolio performance. The annual point-to-point return calculation method ignores the performance of funds throughout the year and is easily biased by abnormal events or unrefined data. In addition, these calculations ignore new funds created or added to the category between the two dates. And yet, these funds represent real investment opportunities.
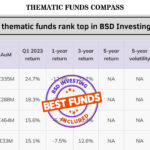
For Example: Between the 12/31/2020 and the 12/31/2021, Global bond Euro hedged active funds underperformed passive funds by 0.6% (non-institutional share classes only). Yet, looking at the data on a rolling basis, during the year, 88% of the time active managers outperformed their passive counterparts (on a yearly basis). And the average positive outperformance spread over 1 year was 2 %.
Knowing what lies behind the numbers and not underestimating the impact of certain methods’ choices is key to making rational decisions and thus being able to build an optimal portfolio. To view BSD Investing full methodology for a fair performance comparisons between active and passive funds click here.
Marlene Hassine Konqui


Leave a Reply
You must be logged in to post a comment.