In 2022, active ETFs represent 60% of newly launched ETFs in the United States and nearly 10% of those launched in Europe. What share for active ETFs in investors’ portfolios worldwide? Are European portfolios following the same trend as those of American investors? The proliferation of new types of ETFs (active, smart beta, factorial, thematic, etc.) which involve an active decision within the index, has blurred the boundary between active and passive ETFs: what is the real place of active ETFs in investors’ portfolios?
What share for active ETFs in investors’ portfolios worldwide?
Active ETFs (i.e. aiming at outperforming their benchmark) are not new but are taking on particular importance, particularly in the United States. The first active management ETFs on the bond segment date from 2008, then from 2014 on the equity market. In 2019, US regulations authorized a new type of ETF more suited to active management, semi-transparent or non-transparent ETFs, which do not have the same transparency obligations as traditional ETFs. In Europe, there are currently only transparent ETFs.
In total, these actively managed ETFs represent 5% of ETF assets worldwide, mainly in the United States. Within bond ETFs, active ETFs represent 11% of assets. Over the past two years, we have seen an acceleration in flows towards this type of ETF. Since the start of 2022, active ETFs represented 15% of ETF flows worldwide, compared to less than 4%, 5 years ago.
Are European portfolios following the same trend as those of American investors?
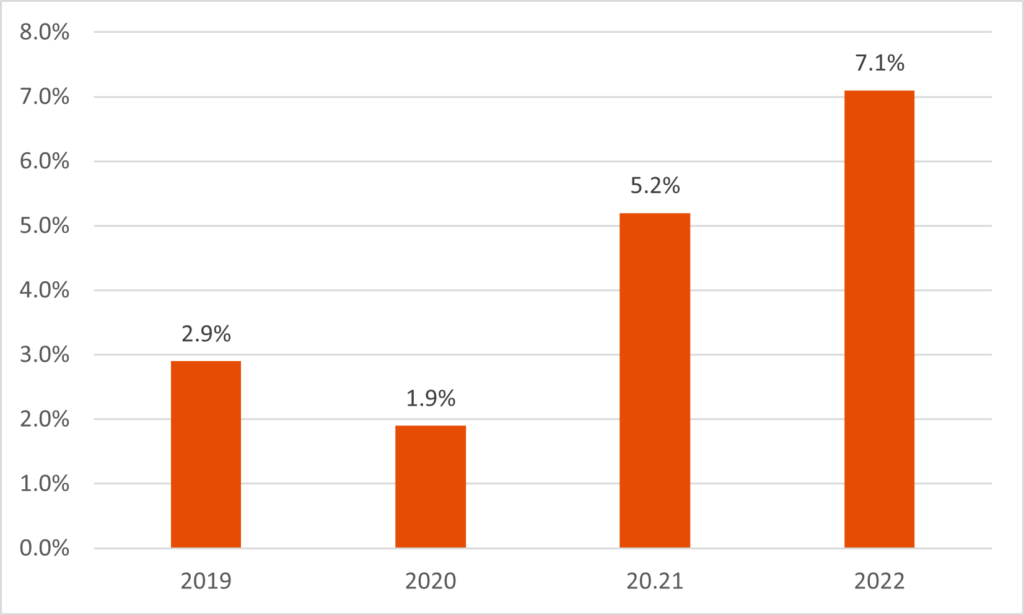
In Europe, active ETFs still represent only 2% of total ETF assets. However, in 2022, they capture nearly 7% of flows, whereas they were almost non-existent in 2018, as shown in the graph below. The third quarter of 2022 confirms this trend, active ETFs continue to collect more than €700m while the ETF market as a whole have seen outflows of nearly €8bn.
Share of active ETFs in ETF flows since 2019
What is the real place of active ETFs in investors’ portfolios?
As explained in the article by Ahmed Khelifa cfa, active ETFs in Europe: Mirage of the best of both worlds or unknown reality? The truth is elsewhere, given the proliferation of new types of ETFs, academic research shows that there are many more active ETFs than is believed. Indeed, it defines two types of active ETFs, ETFs active in form (whose components differ from those of the index) and those active in function (which stick to a specific market segment or factor). In this last case, the active investment decision is made at the level of the index, the composition of which will differ and vary according to the rebalancings and will be closer to an active investment in their function. Active ETFs in fact, include those two types of ETFs.
If we have described above the share of active ETFs in form, what about that of active ETFs in their function within investors’ portfolios?
These include, for example, Smart beta strategies. Moreover, ESMA in its annual performance report (ESMA Annual Statistical Report, Performance and Costs of EU retail Investment Products 2022) considers factor and sector strategies as active investments.
So if we add back smart beta ETF flows to those of active ETFs, overall actively managed ETFs, worldwide, represent 22% of assets and 36% of flows this year. In Europe, it is 8.5% of assets and 11% of flows in 2022.
Marlene Hassine Konqui


Leave a Reply
You must be logged in to post a comment.