BSD Investing has developed leaderboards allowing to rank funds based on its unique proprietary database and research in the field aiming at giving a fair view between active and passive fund performances. This results in significantly different outcomes in terms of the balance between active and passive management than what is commonly accepted in the industry. Our approach corrects significant biases from previous studies available to investors by shedding light on the latest academic and empirical research on the subject. This approach is the result of numerous years of accumulated experience from two experts in fund selection and asset allocation. The outcome of this collaboration gave rise to a new fund selection methodology oriented towards portfolio construction.
In BSD investing & L’Allocataire proprietary methodology, ETFs that do not follow a traditional passive benchmark (Factor, ESG, Thematic..) are included in active fund universes and compared to passive funds following a broader traditional benchmark in order to assess the relevance and suitability of the strategy. The choice of the benchmark will depend on the geographic exposition of the strategy to compare those funds and group them according to their unique commonality, their initial investment universe. Those ETFs with multiple geographic exposures should be compared to a broad market index with a global exposure, i.e. the MSCI ACWI index. Read all the details about our new methodology in the following article: “What role for active ETFs in portfolio construction“
We have put in place two types of rankings:
BSD INVESTING ACTIVE FUNDS LEADERBOARD: top 15 index and non index funds showing the highest outperformance consistency vs passive funds following the same benchmark. Our screening is based on short to middle term (1,3,5 years) active funds outperformance consistency vs passive funds.
BSD INVESTING MIXED FUNDS LEADERBOARD: top 15 active & passive funds showing the best risk adjusted historical performance.
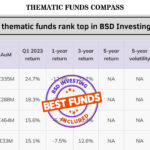
Below the BSD Investing Active funds leaderboard on Europe equity income funds including both index funds (including actively managed ETFs as defined by our methodology- see above) and non index funds.
Best index or non-index European equity income funds

| Fund | Strategy detail | YTD return | 1-year return | 3-year return | 5-year return | 5-year volatility | Non Index fund | Index fund |
|---|---|---|---|---|---|---|---|---|
| Franklin European Quality Dividend UCITS ETF | Dividend Investors: Keep Calm and Carry On (Professionals only) | 6.0% | 6.0% | 35.7% | 28.0% | 15.7% | ||
| WisdomTree Europe Equity Income UCITS ETF | Quality Dividend Growth Video | 11.5% | 12.4% | 40.0% | 15.6% | 18.6% | ||
| Allianz | NA | 11.1% | 12.3% | 28.1% | 6.3% | 16.8% | ||
| Amundi | NA | 10.6% | 10.5% | 42.4% | 40.0% | 17.7% | ||
| Danske | NA | 8.8% | 9.4% | 34.0% | 33.8% | 16.7% | ||
| Deka ETF | NA | 13.7% | 17.3% | 54.2% | 39.6% | 19.5% | ||
| Fidelity ETF | NA | 12.7% | 8.8% | 27.8% | 33.0% | 17.0% | ||
| GS | NA | 11.2% | 10.0% | 41.0% | 32.9% | 17.6% | ||
| HAL | NA | 11.7% | 4.5% | 15.7% | 9.7% | 17.9% | ||
| Invesco | NA | 11.0% | 12.5% | 42.1% | 18.1% | 18.7% | ||
| iShares ETF | NA | 12.6% | 7.5% | 47.0% | 41.3% | 17.9% | ||
| JPM Fund | NA | 9.5% | 9.9% | 37.9% | 16.0% | 17.4% | ||
| Lyxor ETF | NA | 5.8% | 6.3% | 37.4% | 0.0% | NA | ||
| Schroder | NA | 16.6% | 12.1% | 53.9% | 16.7% | 19.6% | ||
| SEBinvest | NA | 15.5% | 8.1% | 31.5% | 15.5% | 17.5% |
Marlene Hassine Konqui


Leave a Reply
You must be logged in to post a comment.